In my earlier article on ‘The hegemony of GDP‘, I discussed the need to go beyond GDP if we are serious about capturing the ‘true’ picture of an economy. We certainly cannot do away with GDP but we can and must make adjustments (both subtractions and additions) to it to reflect the true picture, which here simply means the long-term impact on the economy. The State of Vermont in the US has set an example in this endeavour.
The State of Vermont in the US has spearheaded the adoption of economic indicators that offer a more comprehensive picture of the state of an economy that just GDP, using 26 components which constitute GPI – Genuine Progress Indicator. The number of components is not so important as the logic behind using GPI – GDP can only include privately captured, market-related costs and benefits that are easy to incorporate. Typically, such costs and benefits do not capture the long-term effects such as soil degradation, decline in biodiversity, eclipse of waterbodies and so on, which, one day, like a Black Swan, deal a devastating blow. And ironically, any efforts to rectify (to the extent feasible) will add to the GDP!
Over the course of the 20th century, many indices have been developed such as Global Hunger Index, Human Development Index, Sustainable Development Goals, Literacy ration and so on. In India, until recently, the annual Economic Survey, which is not expected to adhere to the government of the day, offered a comprehensive picture of the Indian economy, although not condensed into a single Index. In simple terms, the data is already captured and we have to develop a methodology to aggregate all separate indices into one Index, using appropriate weights to reflect the relative roles of various components.
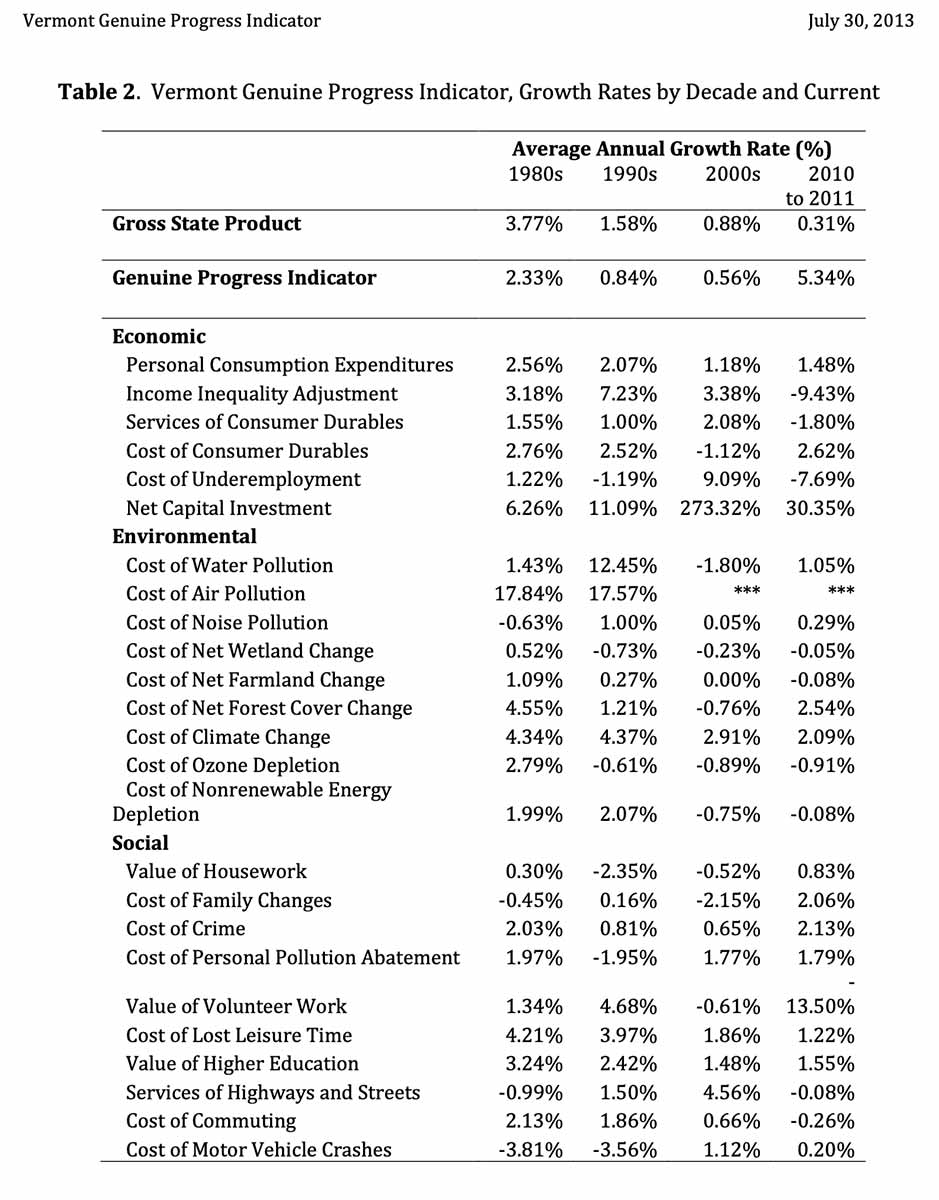
As the State of Vermont says in its inaugural report, “generally GPI begins with personal consumption from GDP, adjusts for income distribution, and then includes a series of subtractions for ignored and miscounted costs of economic activity and additions of non-market benefits”. (Vermont Genuine Progress Indicator 1960-2011 authored by the Gund Institute for Ecological Economics of the University of Vermont in July 2013 – (https://anr.vermont.gov/sites/anr/files/specialtopics/VTCAC/Eric%20Zencey%20-%20VT%20GPI%20Findings%20and%20Recs.pdf).
There are two tables which concretely demonstrate how we can construct GPI, one for 2011 and another dealing changes over decades, reproduced here from the report I have referred to above.
As we can see, this is a faithful rendering of Simon Kuznets’ dictum to evaluate the costs involved – human and resources – in producing a certain level of GDP. Using this as a format, we can modify the table with any other aspect we deem important. For instance, waste in education and healthcare. Education is a problematic area because it is an aspirational goal. Healthcare was not but of late, it too has become an aspirational goal. Each produces its own waste whose impact on the economy is quite substantial.
Indian modifications
Engineers pursuing a management degree and landing up jobs which don’t need their engineering skills at all. This trend has grown since the late 1980s and has intensified in recent years. Unemployed graduate and post-graduate students including PhD is a common phenomenon in India. The aspirational dimension of education has witnessed an enormous growth since the economic reforms initiated in the 1990s. The result is a tremendous growth in education as a business, with unreasonable fees forcing middle class Indians to resort to education loans. The use of tertiary hospitals for treatments and procedures that can be addressed by ambulatory day care centres is an enormous waste. It adds to the GDP but not to GPI!
Human – animal conflict in parts of India is a serious problem resulting in the deaths of people and the destruction of property in certain instances. The calamitous effects of rampant construction – buildings and factories – leading to landslides and quakes need to be accounted for (as subtractions, of course!).
We can add any number of factors and sub-factors such as deaths due to malnutrition, negligence by public health agencies, preventable health hazards, deforestation and the consequent disasters, the flooding in cities because of indifferent construction without considering the differences in the levels between the buildings and the adjoining roads.